Rust 02. Debugging with rust-analyzer and CodeLLDB
When debugging Rust in VS Code, one of the most practical setups is to use rust-analyzer together with CodeLLDB. This post walks through the basic debugging flow, including breakpoints, variables, the call stack, and argument-based debugging with launch.json.
What to Know First
The approach in this post assumes you are working with a Cargo project created with cargo new project-name.
For example:
cargo new rust-debug-demo
cd rust-debug-demo
code .
If you only compile a single file like rustc hello.rs, the rust-analyzer and CodeLLDB workflow described here does not fit as naturally. This guide is much easier to follow with a Cargo project.
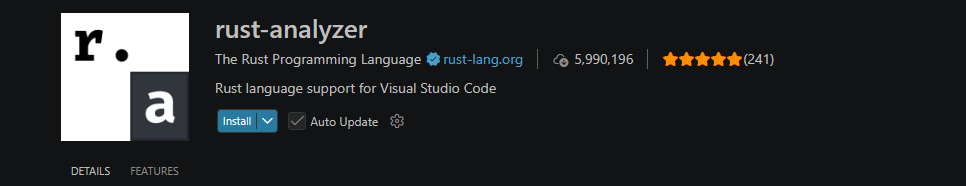
Install rust-analyzer
Install the rust-analyzer extension from the VS Code extensions panel.
Once the extension is installed and you open a Cargo project in VS Code, a Run | Debug button appears above fn main().
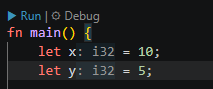
Click Debug there to enter debug mode right away.
Install CodeLLDB
To use a full debugger workflow more comfortably, it is a good idea to install the CodeLLDB extension as well.

CodeLLDB is an LLDB-based debugger extension commonly used for native languages such as Rust in VS Code.
Open Debug Mode with Ctrl+Shift+D
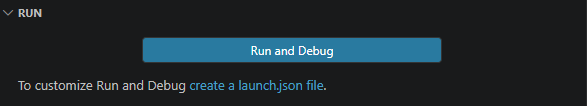
Open the Run and Debug view from the sidebar, or press Ctrl+Shift+D to enter the debugging screen.
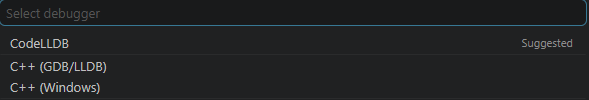
If no debug configuration exists yet, you will see a link labeled create a launch.json file.
Click that link and select CodeLLDB from the debugger list.
What Is launch.json?
launch.json is the configuration file that tells VS Code how to start debugging. It defines which debugger to use, which executable to launch, which working directory to use, and what arguments should be passed to the program.
It is usually stored at:
.vscode/launch.json
In practice, this file controls the overall behavior of your debug session.
Creating launch.json and Example Configuration
On Windows, a simple Rust configuration that directly targets the generated executable can look like this:
{
  "version": "0.2.0",
  "configurations": [
    {
      "type": "lldb",
      "request": "launch",
      "name": "CodeLLDB: Rust Debug",
      "program": "${workspaceFolder}/target/debug/${workspaceFolderBasename}.exe",
      "args": ["abcd", "efgh"],
      "cwd": "${workspaceFolder}"
    }
  ]
}
Each field has a simple role:
type: The debugger type. CodeLLDB useslldb.request: The debug request mode. A standard launch useslaunch.name: The label shown in the VS Code debug configuration list.program: The executable file to debug.args: The arguments passed to that executable.cwd: The working directory for the debug session.
Because this setup points to the executable under target/debug, it is convenient to run cargo build once before starting the debugger.
The Most Useful Basic Keys
When you are just starting, these four keys are enough to understand the main flow:
F5: Start or continue execution until the next breakpointF9: Toggle a breakpoint on the current lineF10: Step over one line at a timeF11: Step one line at a time, but enter a function if one is called
A simple pattern is to place a breakpoint with F9, start with F5, and then use F10 and F11 to inspect the flow.
Setting a Breakpoint
You can click the gutter next to a line or press F9 to place a breakpoint. When a red dot appears, the breakpoint is set correctly.
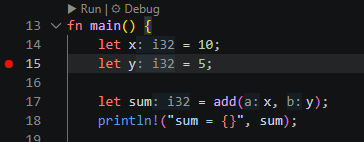
After placing a breakpoint, press Debug or F5. Execution stops on that line, and you can inspect variables and the call flow from there.
Checking Variable Values
When execution is paused, you can inspect the current variables in the VARIABLES section of the debug panel.
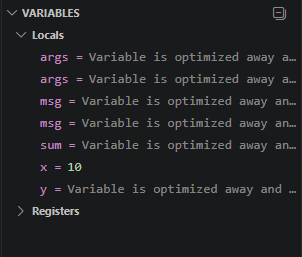
For example, values such as x = 10, y = 5, and sum can be inspected directly there. Depending on the breakpoint location, some values may not have been computed yet, and some entries may appear as optimized away, but this panel is still one of the fastest ways to understand the current state.
Checking the Call Stack
You can inspect the function call flow in the CALL STACK section.
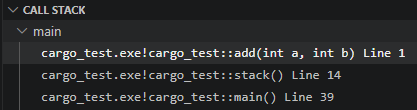
This view shows which function you are currently inside and how execution reached that point. If you use F11, you can step into functions and see how the call stack changes as you move deeper into the code.
Example Code for Checking Arguments
Now let us use launch.json to pass command-line arguments and verify them in the program. Put the following code into src/main.rs:
fn main() {
    let args: Vec<String> = std::env::args().collect();

    if args.len() > 0 {
        println!("args[0] = {}", args[0]);
    }

    if args.len() > 1 {
        println!("args[1] = {}", args[1]);
    } else {
        println!("args[1] is missing.");
    }

    if args.len() > 2 {
        println!("args[2] = {}", args[2]);
    } else {
        println!("args[2] is missing.");
    }
}
This program prints the arguments it receives. One important detail is that args[0] usually contains the executable path, while the values you place in the args array inside launch.json appear starting from args[1] and args[2].
How to Pass Arguments with args
In the launch.json file, the following section is where arguments are passed:
"args": ["abcd", "efgh"]
With this setup, the program receives abcd and efgh as command-line arguments when you start debugging.
Verifying the Output
After saving the configuration and starting the debugger again, you can confirm that the arguments were passed correctly in the output.

As shown in the example, args[0] contains the executable path, while args[1] = abcd and args[2] = efgh confirm that the args setting in launch.json was applied correctly.
Summary
For Rust debugging in VS Code, a practical setup is to use rust-analyzer for the Rust development experience and CodeLLDB with launch.json for the debugger configuration. Once you open the Run and Debug view with Ctrl+Shift+D, create a launch.json file, and pass the arguments you need through args, it becomes much easier to inspect execution flow and test command-line input in one place.
댓글남기기