Rust 02. Debugging with rust-analyzer
One of the easiest ways to start debugging Rust in VS Code is to use rust-analyzer. This post covers the basic flow: install rust-analyzer, enter debug mode with the Run | Debug button, and inspect breakpoints, variables, and the call stack.
What to Know First
The approach in this post assumes you are working with a Cargo project created with cargo new project-name.
For example, you would start like this:
cargo new rust-debug-demo
cd rust-debug-demo
code .
If you only compile a single file like rustc hello.rs, the rust-analyzer debug flow described here does not fit as naturally. The Run | Debug experience is much smoother with a Cargo project.
Install rust-analyzer
Install the rust-analyzer extension from the VS Code extensions panel.
Once the extension is installed and you open a Cargo project in VS Code, a Run | Debug button appears above fn main().
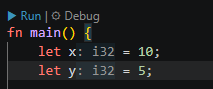
Click Debug there to enter debug mode right away.
Example Code Used in This Post
Put the following code in src/main.rs:
fn add(a: i32, b: i32) -> i32 {
    a + b
}

fn divide(a: i32, b: i32) -> Result<i32, String> {
    if b == 0 {
        Err("Cannot divide by zero.".to_string())
    } else {
        Ok(a / b)
    }
}

fn call_stack() -> i32 {
    add(2, 1)
}

fn main() {
    let x = 10;
    let y = 5;

    let sum: i32 = add(x, y);
    println!("sum = {}", sum);

    for i in 0..3 {
        println!("i = {}", i);
    }

    match divide(x, y) {
        Ok(result) => println!("result = {}", result),
        Err(msg) => println!("error = {}", msg),
    }

    match divide(x, 0) {
        Ok(result) => println!("result = {}", result),
        Err(msg) => println!("error = {}", msg),
    }

    let sum2: i32 = call_stack();
    println!("sub2 = {}", sum2);
}
This sample is good for debugging practice because it includes function calls, a loop, match, error handling, and a clear call stack.
The First Keys to Learn
At the beginning, you only need these four keys:
F5: Run or continue to the next breakpointF9: Toggle a breakpoint on the current lineF10: Step over line by lineF11: Step into a function call
A simple way to get comfortable is to place a breakpoint with F9, start debugging with F5, and then use F10 and F11 to follow the flow.
Set a Breakpoint
Click the gutter to the left of a line, or press F9, to set a breakpoint. If you see a red dot like the screenshot below, it was set correctly.
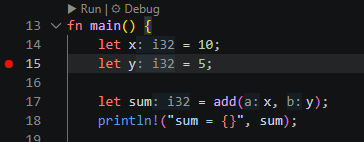
After setting the breakpoint, click Debug or press F5. Execution will stop at that line, and you can inspect values and follow function calls from there.
Inspect Variable Values
While execution is paused, you can inspect the current state in the VARIABLES panel on the left.
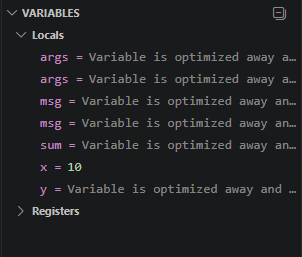
For example, you can directly check values such as x = 10, y = 5, and sum. Depending on where execution is paused, some values may not have been computed yet, and some entries may appear as optimized away. Even so, this panel is still one of the fastest ways to understand the current runtime state.
Check the Call Stack
You can inspect the function call flow in the CALL STACK panel.
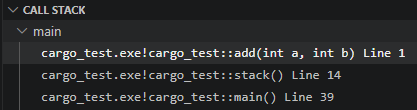
This shows which function you are currently inside and the order of calls that led there. In the sample code, main() calls call_stack(), which then calls add(), so it is easy to see the relationship while stepping through execution.
Using F11 is especially helpful here because you can step into functions and watch the call stack change in real time.
Wrap-up
If you want a smooth debugging workflow for Rust in VS Code, starting with rust-analyzer and a Cargo project is the easiest path. Create a project with cargo new, enter debug mode with the Run | Debug button, and get comfortable with F5, F9, F10, and F11. Once you combine that with the Variables panel and Call Stack view, it becomes much easier to understand how your code is running.
댓글남기기